Support & Resistance Explained
Support and resistance are the cornerstones of technical analysis. In this guide, CIEx Learn explains what these price levels are, how to identify them on a chart, and how to use them to improve your trading decisions.
Understanding support and resistance is like having a map of the battlefield before the fight begins.
What You'll Learn
In this guide, you'll learn:
- What support and resistance are
- How to identify these levels
- How price behaves at these zones
- How traders use support and resistance
- Role reversal — how support becomes resistance
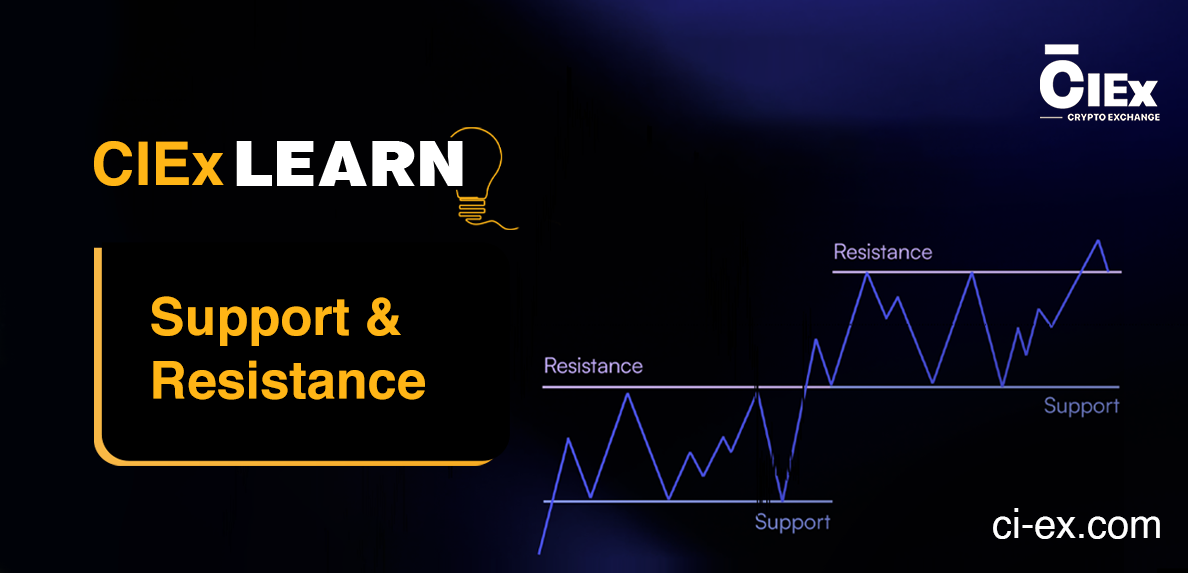
What Is Support?
Support is a price level where buying interest is strong enough to prevent the price from falling further.
Think of support as a floor. When the price drops to this level, buyers step in and push the price back up.
What Is Resistance?
Resistance is a price level where selling pressure is strong enough to prevent the price from rising further.
Think of resistance as a ceiling. When the price rises to this level, sellers step in and push the price back down.
How to Identify Support and Resistance
Look at a chart and identify:
- Price levels where the market has reversed multiple times in the past
- Round numbers (e.g., $50,000 for BTC, $2,000 for ETH) — psychologically significant
- Previous highs and lows — especially on higher timeframes
- High-volume zones — areas where a lot of trading occurred
The more times a level has been tested and held, the stronger it is.
How Price Behaves at These Levels
At Support
- Price may bounce upward
- Traders look to buy near support
At Resistance
- Price may reverse downward
- Traders look to sell near resistance
Breakouts
When price breaks through support or resistance with strong volume:
- A breakout above resistance = bullish signal → new highs possible
- A breakdown below support = bearish signal → new lows possible
Always confirm breakouts with volume before acting.
Role Reversal
Once a support level is broken, it often becomes new resistance — and vice versa.
💡 Example: Bitcoin held $40,000 as support for months. When it broke below, $40,000 became a resistance level. Traders who bought at $40,000 now look to sell at that level to break even.
Common Mistakes to Avoid
- ❌ Treating support/resistance as exact price points rather than zones
- ❌ Ignoring volume when a level is being tested
- ❌ Entering trades at support without a stop-loss below it
✔ Tip: Think of support and resistance as zones, not exact prices. The market rarely stops at a precise number — it tests a range.
Conclusion
Support and resistance are the most universally used concepts in technical analysis. They define where the market has made significant decisions in the past — and often where it will make decisions again. Master these levels and you'll have a powerful edge in the market.
Ready to Get Started?
Create your CIEx Wallet today and:
- 📈 Trade Spot and Futures markets with ease
- 🔀 Access 300+ cryptocurrency pairs
- 💰 Deposit and unlock your welcome bonus
- 👥 Invite friends and earn rewards through the Referral program
- ✅ Complete tasks and earn daily rewards in the Task Center
- 🏦 Stake and earn passive income with daily payouts
- 📱 Manage your portfolio anytime with the CIEx mobile app